Article
Hibernate logging and monitoring guide
Optimize and troubleshoot your persistence layer with Hibernate logs and metrics.


Table of contents
- Introduction
- SQL logging
- Slow queries logging
- Statement metrics
- Session metrics
- Session factory metrics
- Database connection pool metrics
- Conclusion
Introduction
Hibernate is a powerful ORM. It comes with several monitoring features such as logs and metrics/statistics. They can provide valuable insights of the behavior of the persistence layer, in order to optimize the application performances or troubleshoot mapping issues.
These features are available to applications that directly use Hibernate. They also run fine with high level application frameworks such as Spring Boot (for example using Spring Data JPA) or others.
Many of these features are activated by setting the right Hibernate configuration parameters. They can be defined in
source files such as application.properties (or YAML) from Spring Boot, persistence.xml from
JPA, hibernate.cfg.xml from Hibernate, etc.
This article focuses on Spring Boot and will provide configuration samples for your
application.properties. To convert these parameters to standard Hibernate configuration parameters, simply
remove the spring.jpa.properties prefix. For example the standard Hibernate configuration matching
spring.jpa.properties.hibernate.format_sql is hibernate.format_sql.
Update note: this article was originally written for Spring Boot 2. I updated it over time. As of April 2026, the main focus is Spring Boot 4, but I also keep the Spring Boot 3 configuration when it is different.
SQL logging
This is probably the most known and used monitoring feature. Hibernate can log all the executed SQL statements. Usually not recommended in production, it is very useful during development to review the generated SQL and identify persistence issues (N+1 select problems, unintended entity loadings, etc).
It can be enabled by setting the hibernate.show_sql Hibernate parameter or the
spring.jpa.properties.hibernate.show_sql Spring Boot parameter to true.
Or you can simply use the spring.jpa.show-sql Spring Boot shortcut:
spring.jpa.show-sql=trueA sample output:
Hibernate: select author0_.id as id1_0_, author0_.name as name2_0_ from author author0_If you prefer multi-line SQL logs, add the hibernate.format_sql Hibernate parameter:
spring.jpa.show-sql=true
spring.jpa.properties.hibernate.format_sql=true
The output is now:
Hibernate:
    select
        author0_.id as id1_0_,
        author0_.name as name2_0_
    from
        author author0_
Hibernate can also prefix the SQL statement by some comment (by default this is the HQL query, but it can be customized programmatically). It supports both single-line and multi-line SQL logs. A sample configuration:
spring.jpa.show-sql=true
spring.jpa.properties.hibernate.format_sql=true
spring.jpa.properties.hibernate.use_sql_comments=true
A sample output:
Hibernate:
    /* select
        generatedAlias0
    from
        Author as generatedAlias0
    where
        generatedAlias0.name=:param0 */ select
            author0_.id as id1_0_,
            author0_.name as name2_0_
        from
            author author0_
        where
            author0_.name=?
The previous logs are not integrated with the logging framework, meaning that no timestamp or thread name is logged.
If you prefer the SQL logs to integrate with the logging framework, the configuration is a bit different. It does
not use persistence related configuration parameters, simply set the org.hibernate.SQL category to
DEBUG in the logging configuration. For Spring Boot this is:
logging.level.org.hibernate.SQL=debugA sample output:
11:20:41.115 DEBUG org.hibernate.SQL : insert into book (author_id,name,id) values (?,?,default)These integrated logs also support hibernate.format_sql and hibernate.use_sql_comments parameters.
You can also log the parameters of the SQL statements. The corresponding configuration is:
logging.level.org.hibernate.SQL=debug
logging.level.org.hibernate.orm.jdbc.bind=trace
A sample output:
11:20:41.115 DEBUG org.hibernate.SQL                        : insert into book (author_id,name,id) values (?,?,default)
11:20:41.116 TRACE org.hibernate.orm.jdbc.bind              : binding parameter (1:BIGINT) <- [2]
11:20:41.116 TRACE org.hibernate.orm.jdbc.bind              : binding parameter (2:VARCHAR) <- [Book B2]
Slow queries logging
Hibernate can selectively log the SQL statements that take longer than a specified threshold. This is useful to identify the slow queries of the application, for example because of missing indexes.
It can be enabled by setting the hibernate.log_slow_query Hibernate
parameter to the target duration in milliseconds. For example to use a threshold of 100 milliseconds:
spring.jpa.properties.hibernate.log_slow_query=100A truncated sample output:
11:27:38.064 INFO org.hibernate.SQL_SLOW : Slow query took 137 milliseconds [select (...truncated...)]Statement metrics
Hibernate can provide various metrics: statement metrics, session metrics and session factory metrics. The statement metrics log the duration (in milliseconds) and the number of returned rows for many SQL statements.
The configuration for Spring Boot 4 has been simplified:
logging.level.org.hibernate.statistics=debugA sample output:
11:36:01.955 DEBUG org.hibernate.statistics : HHH000117: Query: [CRITERIA] select a1_0.id,a1_0.name from author a1_0, time: 2ms, rows: 2The Spring Boot 3 configuration is a bit different. First, it requires to enable the Hibernate statistics. But Hibernate statistics, when enabled, log session metrics (described in the next section). So if you only need statement metrics, you should disable the session metrics logs. The configuration is:
spring.jpa.properties.hibernate.generate_statistics=true
logging.level.org.hibernate.stat=debug
logging.level.org.hibernate.engine.internal.StatisticalLoggingSessionEventListener=off
Note that the statement metrics do not log all statements, for example the metrics from the findById,
save, delete methods of your Spring Data JPA repositories will not be logged.
Session metrics
Hibernate can provide session metrics, also known as L1 (first-level) stats. This means that whenever an Hibernate session is closed, various metrics for that session will be logged such as: JDBC connection usage, number of executed statements, second-level cache usage, etc. To do so, once again enable the Hibernate statistics and enable the right Hibernate logger. For example to log the session metrics but not the statement metrics:
The Spring Boot 4 configuration has been simplified:
logging.level.org.hibernate.session.metrics=debugA sample output:
12:08:20.868 DEBUG org.hibernate.session.metrics            : HHH000401: Logging session metrics:
	24700 ns acquiring 1 JDBC connections
	0 ns releasing 0 JDBC connections
	1104800 ns preparing 5 JDBC statements
	4086000 ns executing 5 JDBC statements
	0 ns executing 0 JDBC batches
	0 ns performing 0 second-level cache puts
	0 ns performing 0 second-level cache hits
	0 ns performing 0 second-level cache misses
	15082500 ns executing 1 flushes (flushing a total of 5 entities and 2 collections)
	0 ns executing 0 pre-partial-flushes
	0 ns executing 0 partial-flushes (flushing a total of 0 entities and 0 collections)
Once again the Spring Boot 3 configuration is different. First enable the Hibernate statistics, then configure the loggers. For example to display the session metrics but not the statement metrics:
spring.jpa.properties.hibernate.generate_statistics=true
logging.level.org.hibernate.stat=off
logging.level.org.hibernate.engine.internal.StatisticalLoggingSessionEventListener=info
Of course, it is possible to log both statement and session metrics by cumulating the configurations.
The log contain a lot of useful information but is verbose. If you prefer a custom or more compact output format, it is possible to provide your own implementation. See my com.adeliosys.sample.CustomSessionEventListener class from the linked repository. In that case, the Spring Boot 4 configuration is now:
spring.jpa.properties.hibernate.session.events.auto=com.adeliosys.sample.CustomSessionEventListenerA sample output for a different use case:
10:55:24.624 DEBUG c.a.mockup.CustomSessionEventListener    : Session metrics:
    connections  : acquired 1 (44 μs), released 0 (0 μs)
    statements   : executed 4 (2589 μs), prepared 4 (1645 μs)
    JDBC batches : executed 0 (0 μs)
    cache        : 0 puts (0 μs), 0 hits (0 μs), 0 misses (0 μs)
    flushes      : executed 0 (0 μs) for 0 entities and 0 collections, executed 1 partials (12 μs) for 0 entities and 0 collections
Session factory metrics
Hibernate can provide session factory metrics, also known as L2 (second-level) stats. They are useful to understand the
persistence operations that are executed over time, the most used entities, the most frequent or slow queries, etc.
Session factory metrics can also be enabled by setting hibernate.generate_statistics to true
as previously seen or programmatically by executing sessionFactory.getStatistics().setStatisticsEnabled(true).
Then you can use the statistics API to get much information:
// To get the SessionFactory from the EntityManagerFactory, if needed
SessionFactory sessionFactory = entityManagerFactory.unwrap(SessionFactory.class);
Statistics stats = sessionFactory.getStatistics();
// The number of sessions opened by this session factory so far
long openedSessionCount = stats.getSessionOpenCount();
// The number of inserts for the book entity
EntityStatistics bookEntityStats = stats.getEntityStatistics(Book.class.getName());
long bookInsertCount = bookEntityStats.getInsertCount();
// The average duration of a query
String[] queries = stats.getQueries();
QueryStatistics queryStats = stats.getQueryStatistics(queries[0]);
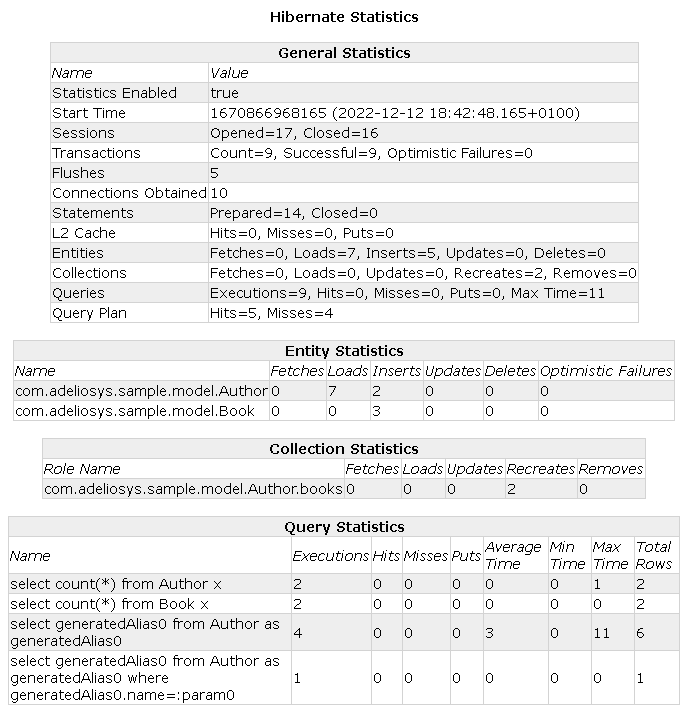
long averageDuration = queryStats.getExecutionAvgTime();I wrote, a long time ago, a simple utility class to log the session factory metrics in a compact HTML format. The source link is com.adeliosys.sample.HibernateStatisticsUtil from the repository mentioned at the end of this article. Here is a sample snapshot of the generated HTML page:
Database connection pool metrics
Most database connection pool libraries provide usage metrics. They are useful to detect saturation and help fine tune the connection pool. Hikari, the default connection pool used by Spring Boot, is no exception. Its metrics can be accessed programmatically or using JMX.
Hikari relies on default configuration values. For example, Hikari pools use a default maximum of 10 connections.
This may not be enough for your application. You should configure the pool for your application requirements.
Here is a sample configuration with several common parameters for your application.properties
(see also HikariCP documentation for additional information):
# Maximum number of connections in the pool.
# Defaults to 10.
spring.datasource.hikari.maximum-pool-size=20

# Minimum number of idle connections maintained in the pool.
# Defaults to 'maximum-pool-size' in order to use a fixed size pool.
# Define this parameter only if you want to save on connections.
spring.datasource.hikari.minimum-idle=10

# Used only when 'minimum-idle' is lower than 'maximum-pool-size', this is the
# duration (in ms) when an idle connection is eligible for removal.
# Defaults to 10 minutes.
spring.datasource.hikari.idle-timeout=300000

# Maximum total duration (in ms) of a connection in the pool.
# Should be a bit lower than the database or infrastructure connection time limit.
# Defaults to 30 minutes.
spring.datasource.hikari.max-lifetime=3500000

# Maximum duration (in ms) the application will wait for a connection,
# before an exception is thrown by the pool.
# This is your trade-off between waiting and failing.
# Defaults to 30 sec.
spring.datasource.hikari.connection-timeout=10000
Here is some code sample to programmatically get the Hikari metrics:
// To get the Hikari data source from the JDBC data source
HikariDataSource hikariDataSource = (HikariDataSource) dataSource;
// The maximum number of connections allowed by the pool
int maxConnections = hikariDataSource.getHikariConfigMXBean().getMaximumPoolSize();
// The total number of connections currently in the pool
int totalConnections = hikariDataSource.getHikariPoolMXBean().getTotalConnections();
// The current number of active (i.e. used) connections
int activeConnections = hikariDataSource.getHikariPoolMXBean().getActiveConnections();
// The current number of threads waiting for an available connection
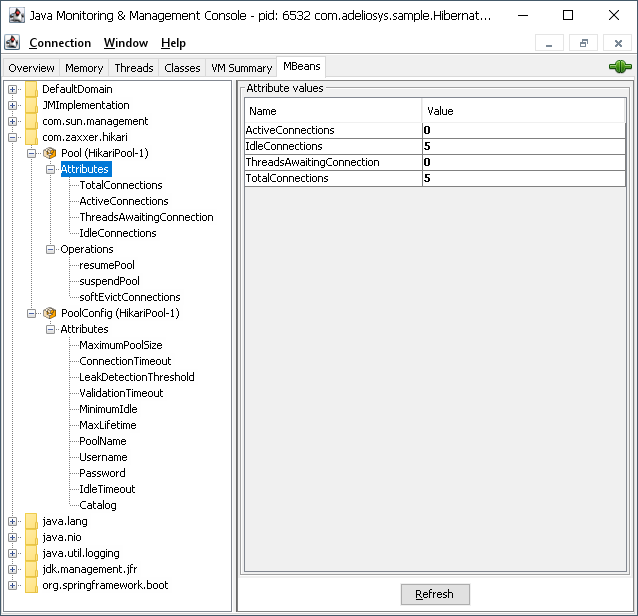
int threadsWaiting = hikariDataSource.getHikariPoolMXBean().getThreadsAwaitingConnection();By default, Hikari exposes an MBean providing the configuration parameters (maximum pool size, idle timeout, etc).
To additionally expose the usage metrics (active connections, threads waiting, etc), make sure to set the
registerMbeans Hikari configuration parameter to true. When using Spring Boot this can be
done by setting spring.datasource.hikari.register-mbeans to true. Then from your JMX client,
the MBeans can be found under com.zaxxer.hikari:
Conclusion
We saw how to use several Hibernate monitoring features such as logs and metrics/statistics. They helped me troubleshoot and optimize the persistence layer of many applications. I hope they will help you too.
A sample project is available on GitHub, see hibernate-monitoring. The project README describes how to use the application.